LESSON 01START OF THE PATHAvailable
What is spectroscopy?
Full lesson: Read lesson 1 — from radiation–matter interaction to the spectrum

LEARN IR
Study the principles, explore annotated examples and apply this knowledge to a real spectrum. Theory gives context to the bands; the tool organizes observations and suggestions for you to assess.
5 steps20 lessonsinteractive learning
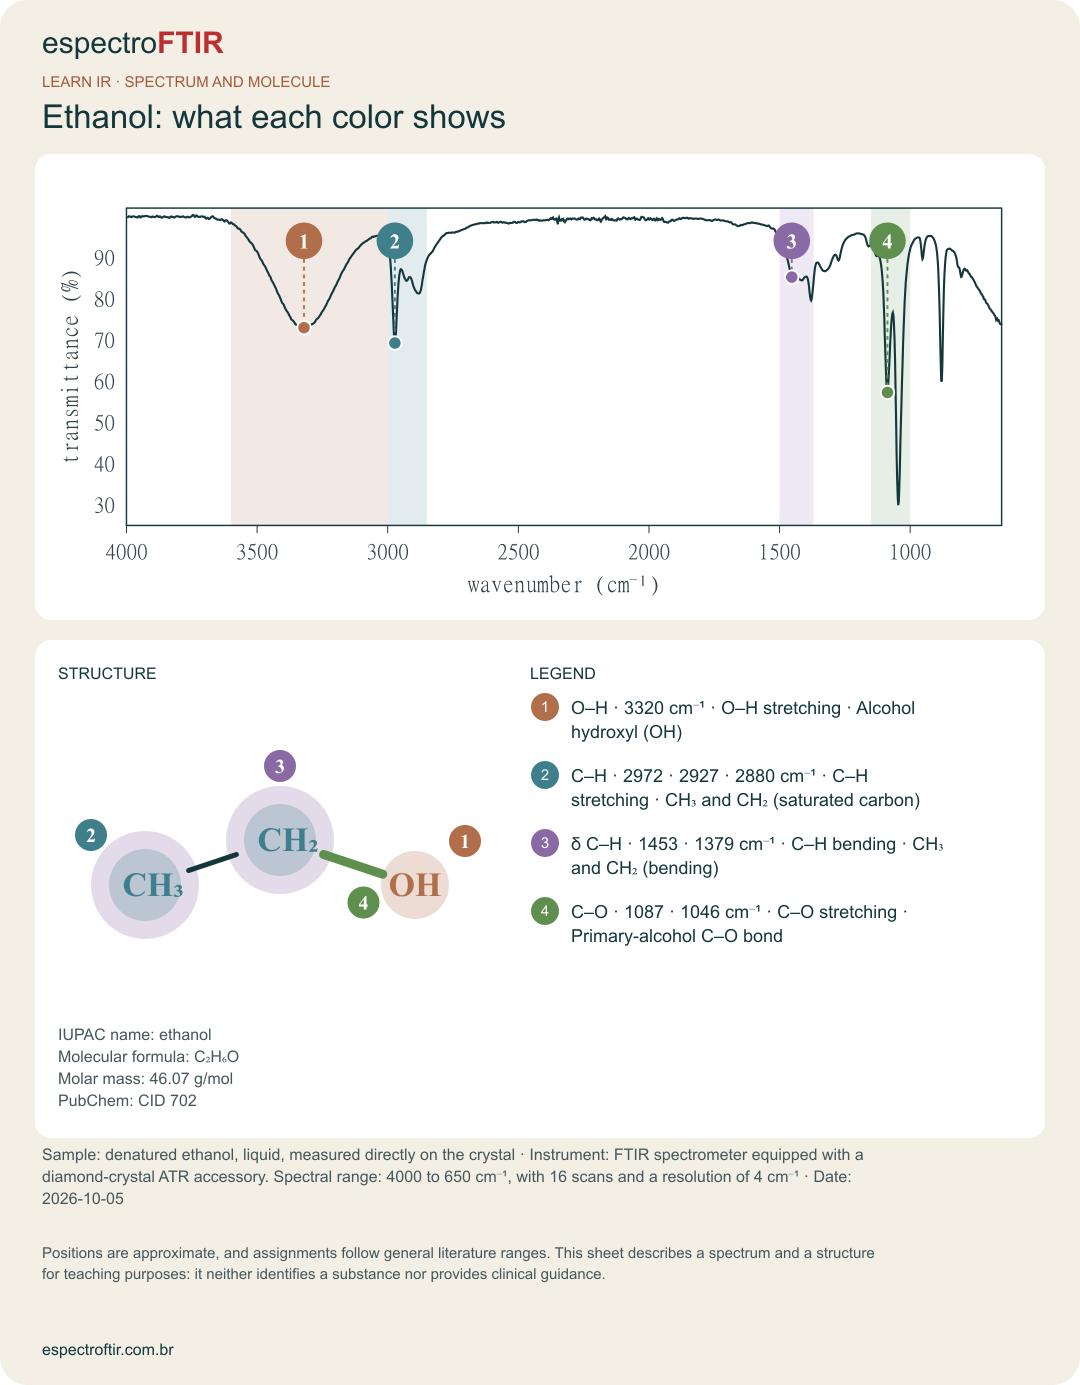
Ethanol · a real analysis example
View this analysis report ↗Hover, tap or use Tab on the colored regions.
SUGGESTED PATH
5 steps · 20 planned lessons · interactive learning. Expand a step to view its question, lessons and learning milestone.
Guiding questionHow can radiation provide information about matter?
Full lesson: Read lesson 1 — from radiation–matter interaction to the spectrum
Full lesson: Read lesson 2 — electromagnetic radiation, quantities and scales
Full lesson: Read lesson 3 — absorption, transmission, reflection and scattering
Full lesson: Read lesson 4 — electronic, vibrational and rotational levels, Boltzmann and the spectrum of HCl
Learning milestoneExplain, in your own words, what a spectrum represents.
In practice See an annotated spectrum with bands and regions in the sample report.
Guiding questionWhy do molecules absorb particular frequencies?
Supporting material: Molecular vibrations and spectral regions
Existing supporting material: Vibrations and spectral regions
Existing supporting material: Vibrations and spectral regions
Existing supporting material: Vibrations and spectral regions
Learning milestoneExplain why not every vibration produces an observable IR band.
In practice Look up the ranges for each vibration in the frequency table.
Guiding questionHow is the plot produced, and when is it reliable?
Existing supporting material: How the analysis works
Existing supporting material: Compare ATR and transmission Prepare and export .0 files
Existing supporting material: How to interpret an FTIR spectrum Frequency table
Existing supporting material: Prepare and export .0 files Convert spectrum file to CSV
Learning milestoneRecognize situations where acquisition should be reviewed before assigning bands.
In practice Before interpretation, the report evaluates range, sampling interval, noise, baseline and saturation (how the analysis works).
Guiding questionWhat structural information does the band pattern support?
Existing supporting material: Map of spectral regions
Existing supporting material: Frequency table
Existing supporting material: Frequency table Carbonyl bands Amine salts
Existing supporting material: Carbonyl bands Effect of the sampling technique
Learning milestonePropose functional groups from combined evidence while recognizing overlaps and ambiguities.
In practice The report band table combines position, intensity, width and assignment (view example).
Guiding questionWhich conclusion is supported, and what remains undetermined?
Existing supporting material: Interpretation workflow
Existing supporting material: Carbonyl bands Comparing polymers by FTIR
Existing supporting material: Annotated-spectrum example Interpretation criteria
Existing supporting material: Application: polymers by FTIR Annotated-spectrum example
Learning milestoneProduce an evidence-based interpretation that distinguishes observation, assignment, hypothesis and conclusion.
In practice Interpretation by region and evidence status distinguish observation, assignment and hypothesis (how to read the report).
INDEX
Search or filter by topic.
Why spectra have bands and how to interpret them.
No resources found. Try another search term or filter.
OBSERVE
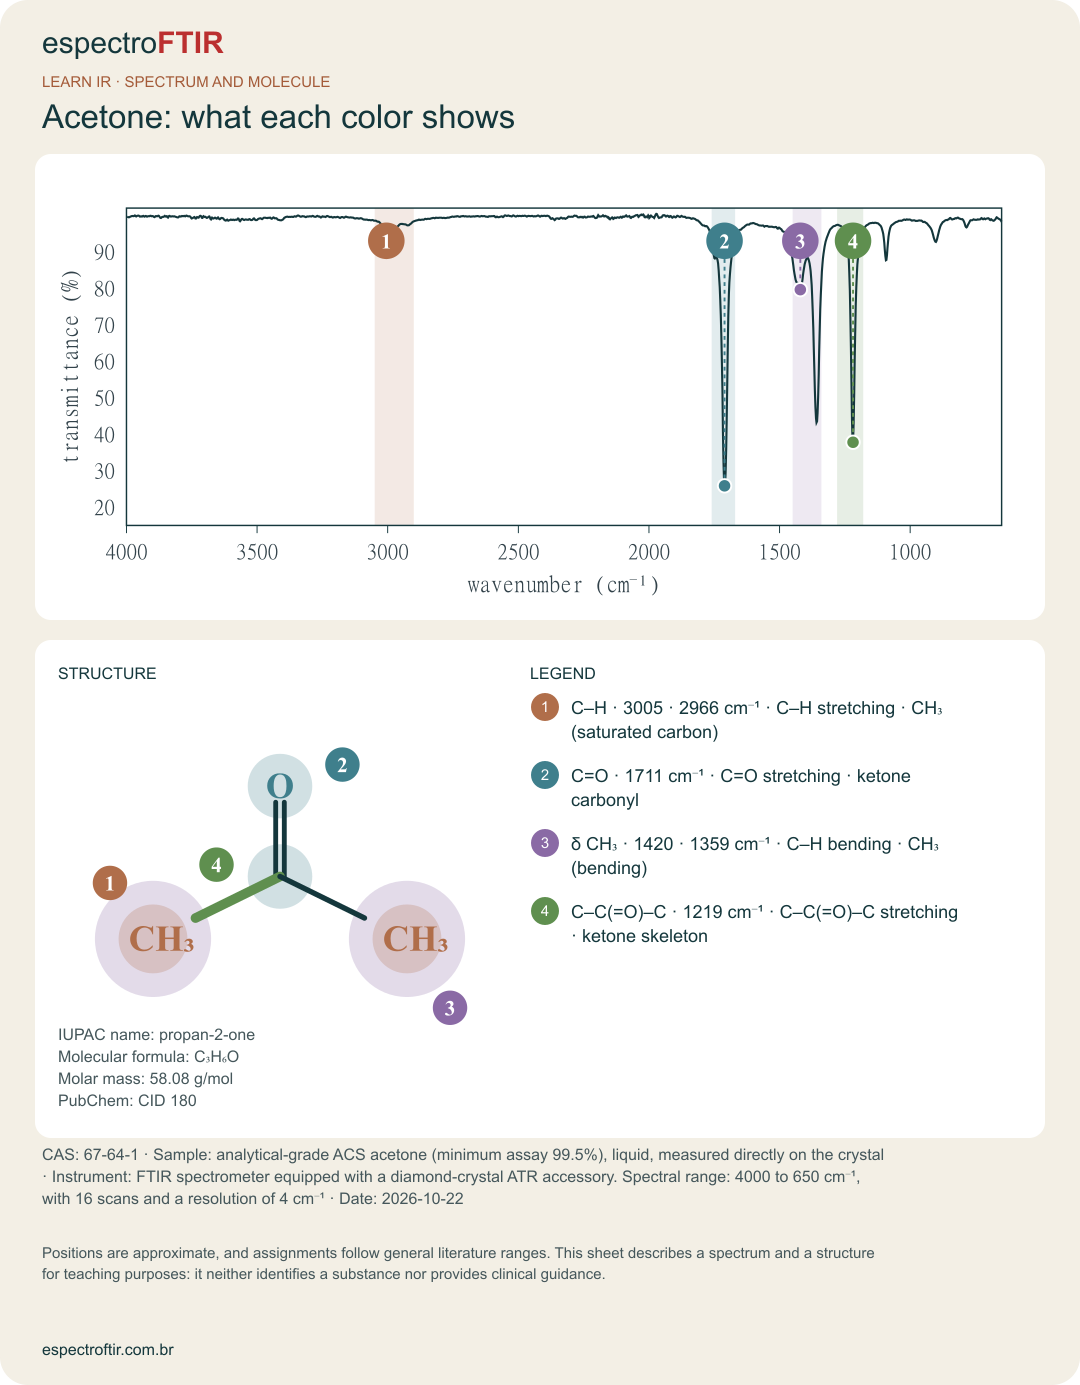
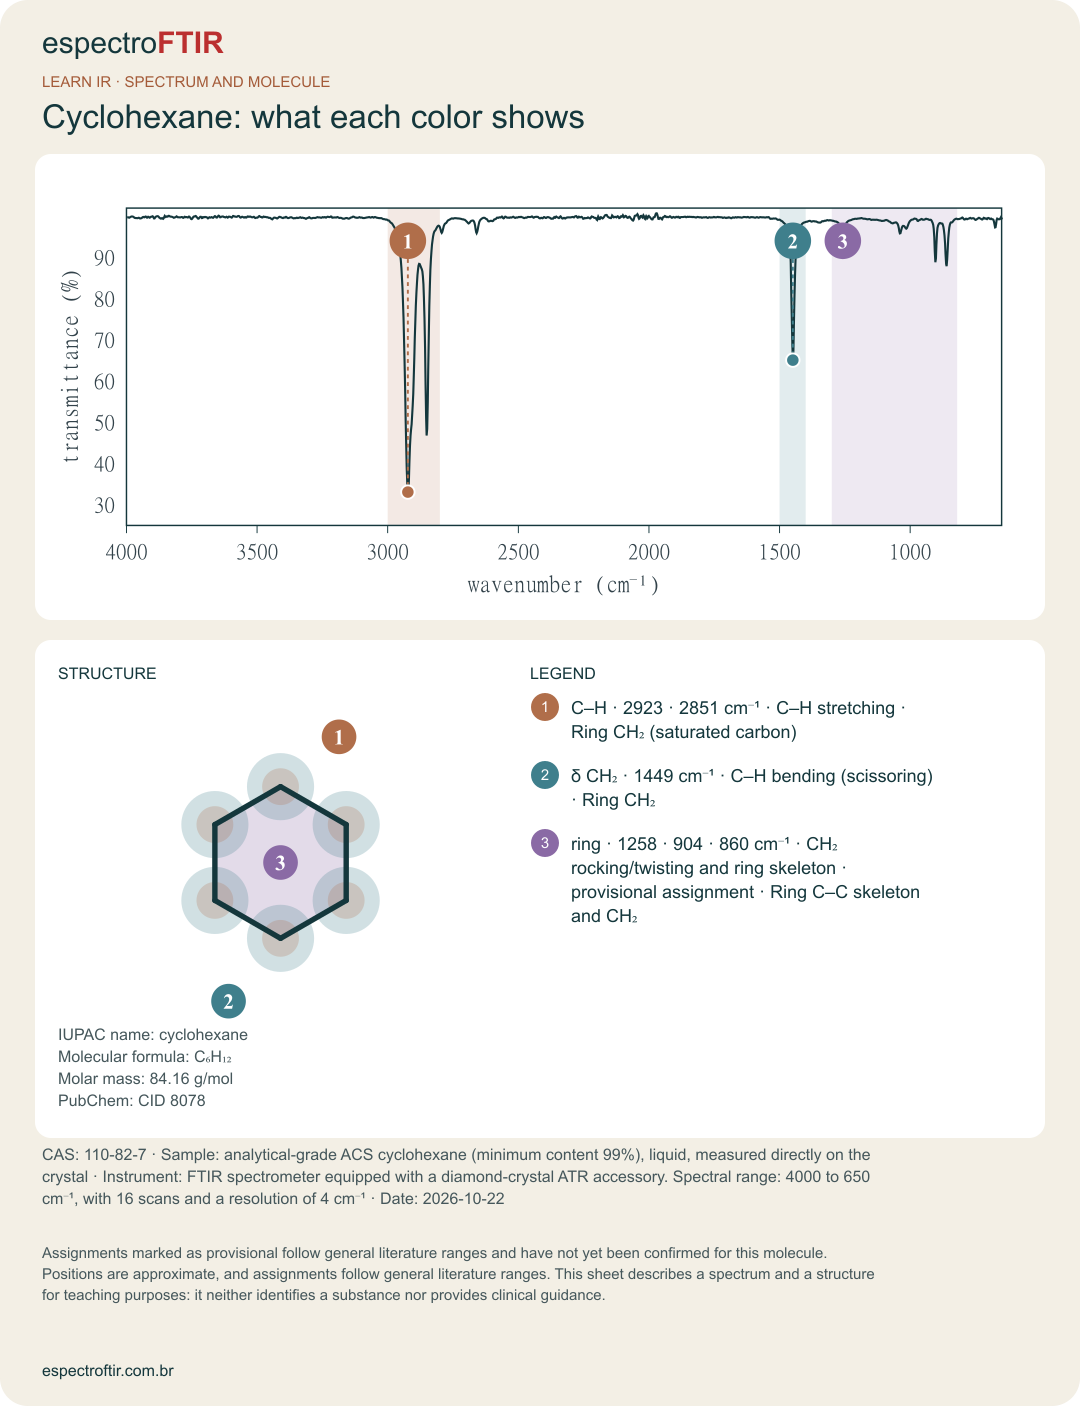
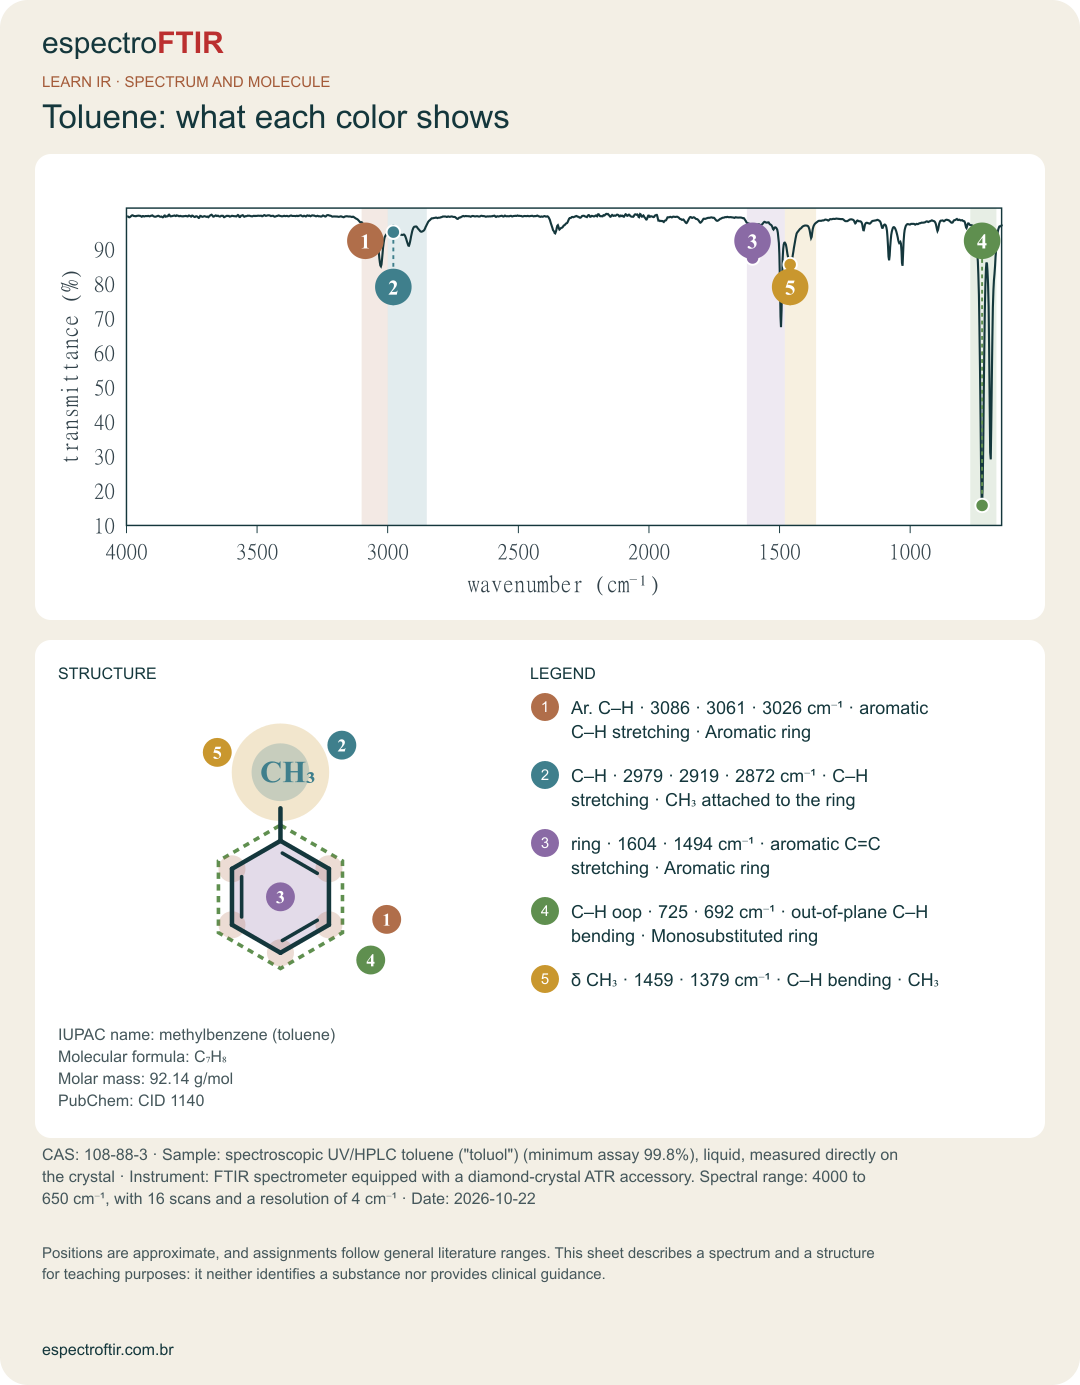
See where each molecular group appears in a real spectrum before interpreting your file.
Start with the 4 open sheets. To view the others, sign in with the same email and code used for analysis: access does not use credits, and new sheets are added as they are measured and reviewed.
BEYOND THE LEARNING PATH
FTIR applications, research and reference tools.
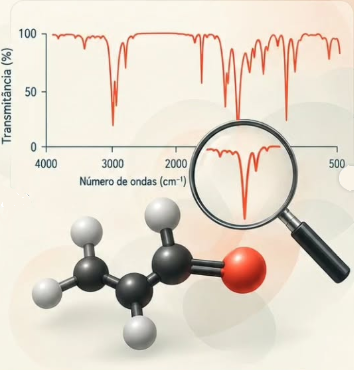
Uses of FTIR in materials, polymers, pharmaceuticals and forensic contexts.
In preparationAvailable now: polymers by FTIR · spectrum and molecule sheets · spectra compilation · sample report
Compare spectral evidence and develop hypotheses consistent with the data, without treating similarity as confirmation of identity.
In preparationAvailable now: how the analysis works · spectra compilation · frequency table with open sources

Quick reference for studying, checking ranges and preparing data for analysis.
Existing resourcesWorkstation · Frequency table · Image to CSV · Spectrum file to CSV
FROM THEORY TO PRACTICE
The analysis provides observations and suggestions that must be interpreted in context; by itself, it does not confirm the identity of a substance.