
LEARN IR · POCKET GUIDE
A workflow for reading an FTIR spectrum
Free two-page PDF with no registration. Updated on 18/10/2026.
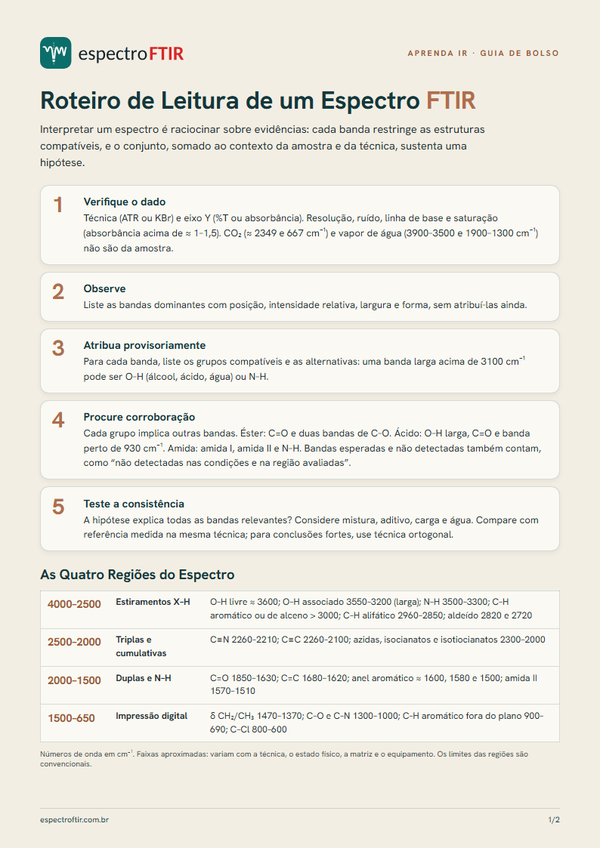
A handy guide for interpreting an infrared spectrum: a five-step workflow, spectral regions, C=O band positions by class and common mistakes. This is a quick reference; the complete reasoning is covered in the Learn IR lessons.
What is in the guide
- A five-step workflow: check data, observe, assign, seek corroboration and assess consistency.
- The four spectral regions and their typical bands.
- C=O positions by class: esters, ketones, aldehydes, acids, amides and anhydrides.
- From observation to conclusion, with an example.
- Common mistakes and sources consulted.
Original espectroFTIR material. Ranges are approximate, and the workflow supports interpretation: it does not identify substances. Share with attribution.
Further reading
Lesson 1: What is spectroscopy?Lesson 2: What is light?Molecular vibrations and spectral regionsGuide: how to interpret an FTIR spectrumThe full Learn IR path
Apply it to your spectrum
Upload a spectrum and see the workflow in practice: annotated bands, an assignment table, interpretation by region and data-quality assessment.
Follow @espectro.ftir on Instagram for upcoming lessons.