
REAL EXAMPLE · ETHANOL
What you receive with each analysis
This page shows the result of an analysis performed by espectroFTIR using a laboratory-measured ethanol spectrum (diamond-crystal ATR, 4000 to 650 cm⁻¹, 16 scans, resolution 4 cm⁻¹). No data were altered. Hover, tap or use Tab on the colored regions to explore what each one contains.
1. Annotated spectrum
Hover, tap or use Tab on the colored regions.
Detected peaks labeled by wavenumber, with functional-group ranges associated with each region. The colored strip below numbers the four report regions.
2. Compatible class
The class follows from the spectral regions and supporting bands rather than a particular substance: the report describes observations and does not identify the substance.
3. Interpretation by region
4. Band table
| Position (cm⁻¹) | Intensity | Primary assignment | Supporting bands |
|---|---|---|---|
| 3318 ± 2 | Weak to medium | ν O–H: Alcohol hydroxyl (hydrogen-bonded O–H) | ~1046 (ν C–O) |
| 2972 ± 2 | Medium | ν Aliphatic C–H: Carbon chain | ~1379 (δ CH₂ / CH₃) |
| 2880 ± 2 | Very weak | ν Aliphatic C–H: Carbon chain | ~1379 (δ CH₂ / CH₃) |
| 1379 ± 2 | Weak | δ CH₂ / CH₃: Carbon chain | ~2972 (ν C–H) |
| 1087 ± 2 | Weak to medium | ν C–O: Aliphatic alcohol (alcohol C–O) | ~3318 (ν O–H) |
| 1046 ± 2 | Very strong | ν C–O: Aliphatic alcohol (alcohol C–O) | ~3318 (ν O–H) |
| 953 ± 2 | Very weak | — (no range in the general table) | — |
| 879 ± 2 | Medium | — (no range in the general table) | — |
When a band has no corresponding range in the general functional-group table, the report states this and leaves the assignment to the user. The uncertainty (±) reflects data sampling, not instrument accuracy.
5. Full report
In addition to the plot and table, you receive a report with sample identification, a spectrum quality assessment (with the bands numbered on the plot and guidance for the next measurement), methods, interpretation by region, limitations and traceability. Download the full example:
Keep exploring
Another example: a polyester (ATR)
An ATR polyester spectrum, with ν C=O at ~1713 cm⁻¹, ν C–O–C at ~1239 cm⁻¹ and aromatic-ring bands (class: esters and aromatic compounds). The sample does not belong to any user.
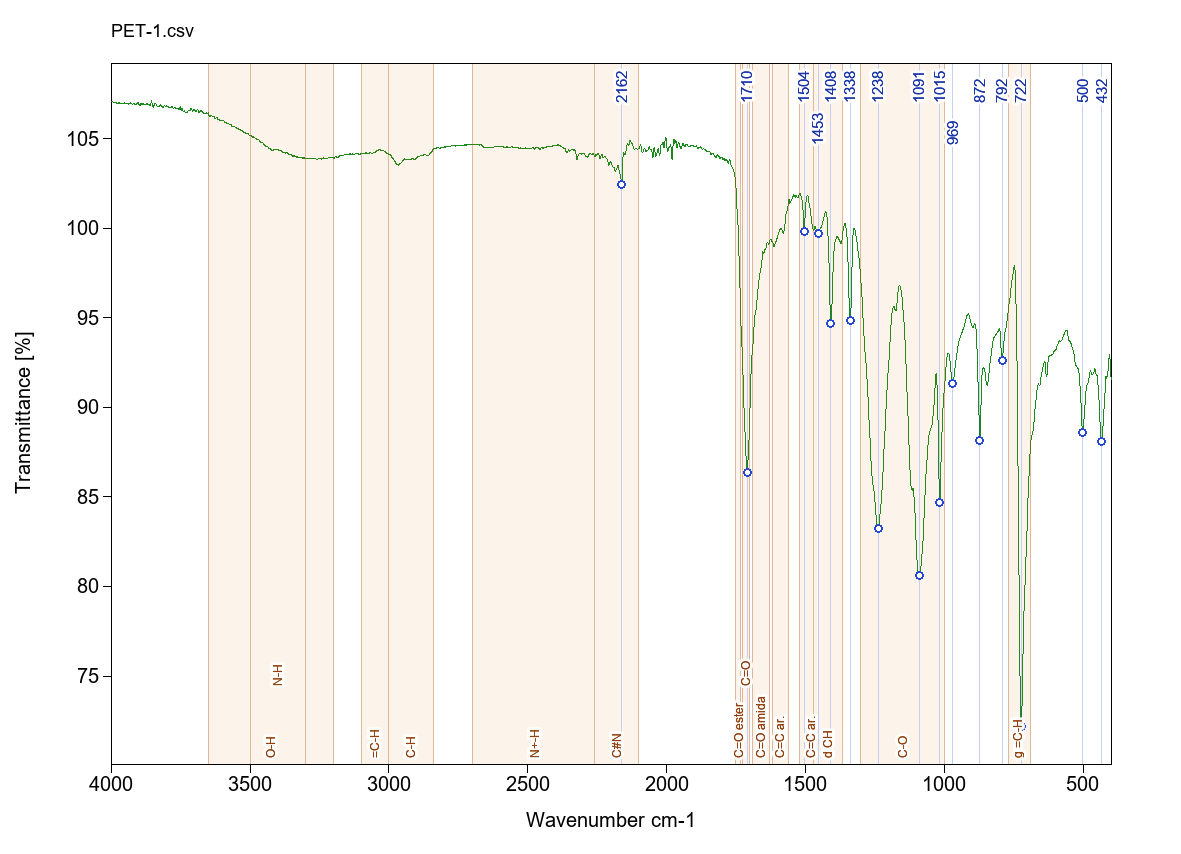
Spectrum: ATR spectral library from the FTIR Analyzer PRO project (LaCom/UFRJ), MIT license, used with attribution.