LEARN IR · SPECTRUM AND MOLECULE
Ethanol: what each color shows
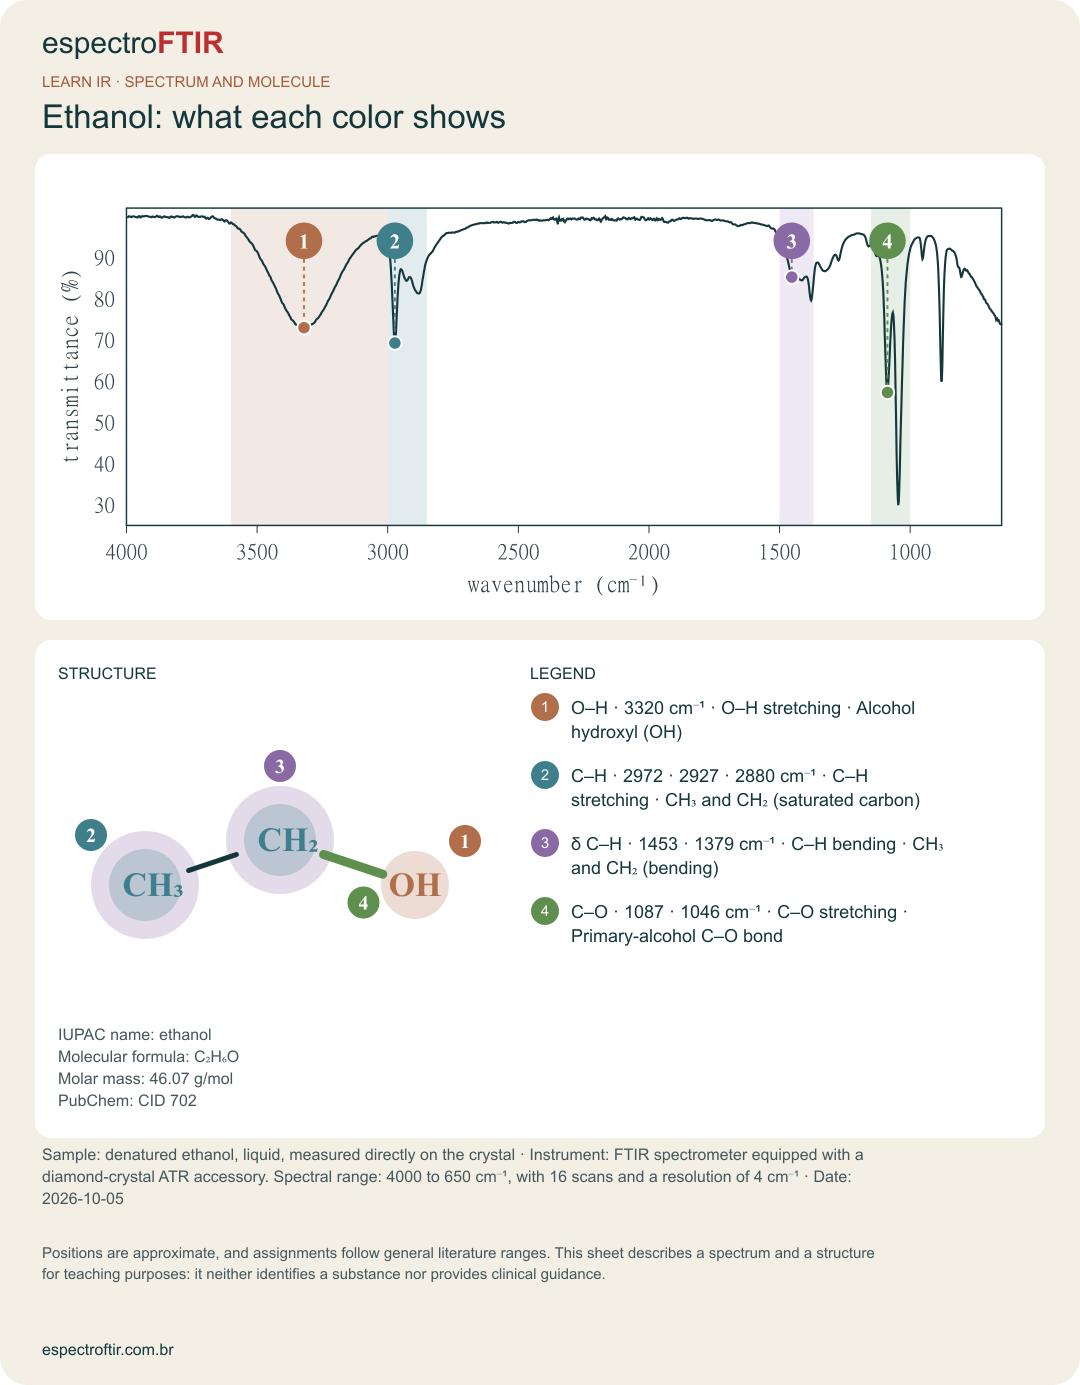
Laboratory-measured spectrum of denatured ethanol, linked to the molecule. Hover, tap or use Tab on a legend item to highlight the corresponding band and group.
- 1O–H3320 cm⁻¹ · O–H stretchingAlcohol hydroxyl (OH)
- 2C–H2972 · 2927 · 2880 cm⁻¹ · C–H stretchingCH₃ and CH₂ (saturated carbon)
- 3δ C–H1453 · 1379 cm⁻¹ · C–H bendingCH₃ and CH₂ (bending)
- 4C–O1087 · 1046 cm⁻¹ · C–O stretchingPrimary-alcohol C–O bond
Substance identification
- IUPAC name
- ethanol
- Molecular formula
- C₂H₆O
- Molar mass
- 46.07 g/mol
- PubChem
- CID 702
How the measurement was made
- Sample
- denatured ethanol, liquid, measured directly on the crystal
- Instrument
- FTIR spectrometer equipped with a diamond-crystal ATR accessory. Spectral range: 4000 to 650 cm⁻¹, with 16 scans and a resolution of 4 cm⁻¹
- Date
- 05/10/2026
Sources and limitations
- PAVIA, D. L.; LAMPMAN, G. M.; KRIZ, G. S.; VYVYAN, J. R. Introdução à espectroscopia. Translation of the 4th US edition. São Paulo: Cengage Learning, 2010 (general ranges).
- PubChem. Ethanol, CID 702. National Library of Medicine (formula checked on 22/10/2026).
Positions are approximate, and assignments follow general literature ranges. This sheet describes a spectrum and a structure for teaching purposes: it neither identifies a substance nor provides clinical guidance.
Spectrum and molecule galleryLearn IR pathDownload the card (PNG)Analyze a spectrum