
Interpret
Full curve and a sample of interpreted bands. Short PDF, no signup and no credits used.
New: spectrum comparison — references, 1×1 difference, serial and guided. See the modes

Infrared spectroscopy
Free preview, no signup: full curve and a sample of interpreted bands, on the page and in PDF. Sign in to search for similar spectra and compare against your references.
Ethanol · a real analysis example
View this analysis report ↗Hover over regions or bands. On mobile, tap the numbers below.
REPORT EXAMPLES
Click the thumbnails to open examples. No credits are used.
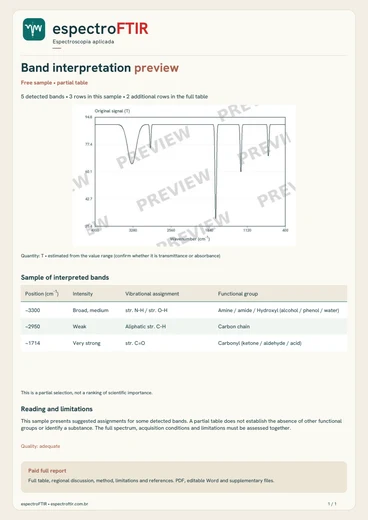 Free previewFull watermarked curve and up to three band rows. One-page PDF, no signup required.View preview PDF Example using synthetic data.
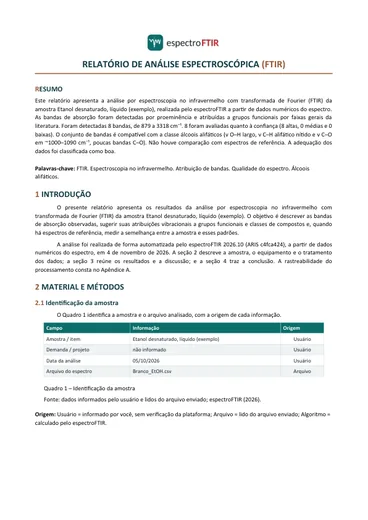 Full reportFull band table, interpretation by region, method, limitations and references.View report PDF
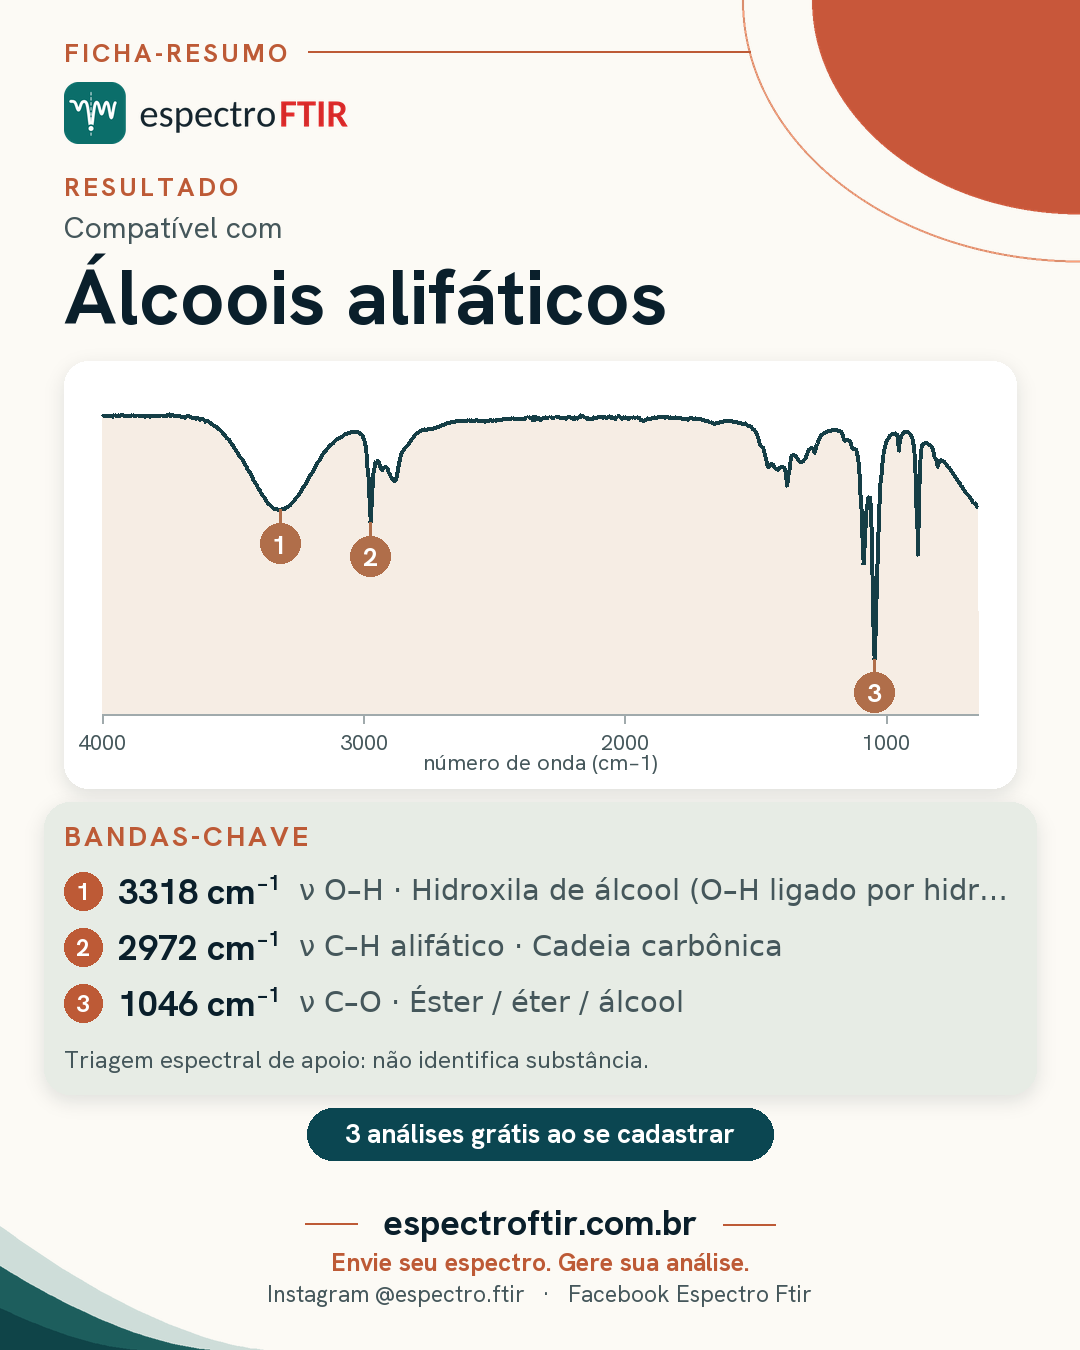 Summary sheetPlain-language summary of the main analysis results.View summary-sheet card
Generating your own full report or summary sheet requires 1 credit per spectrum. Free credits provide PDF only; paid credits also include editable Word and supplementary files for the selected format.
WHAT YOU CAN DO
All include the spectrum interpretation. The others add a comparison on top.
Full curve and a sample of interpreted bands. Short PDF, no signup and no credits used.
Ranking of the most similar spectra in a site library. Does not confirm identity.
Compares against spectra you measured. With the same technique, the report includes the HQI.
Sample against a reference: correlation, residual, and shared and altered bands.
About the libraries. More than 6,000 reference spectra, public, from third parties with credit, and from an internal collection, were used to develop and verify the method. The site's libraries come from third parties and are used with credit to each source; we do not share, redistribute or sell spectrum files. Credits · Each spectrum uses 1 credit. Eligible new accounts receive 1 welcome credit; existing balances are preserved.
STUDY AND EXPLORE
Look up a topic, explore frequencies or practice with online tools. All guides →
SPECTRUM AND MOLECULE SHEETS
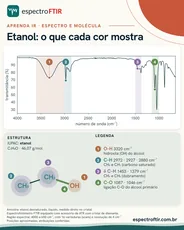 EthanolAlcohol. Each color links a band of the spectrum to a group of the molecule.Open the sheet
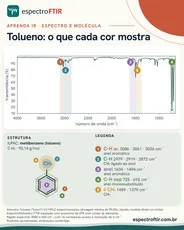 TolueneAromatic. See the ring, the CH₃ and the out-of-plane bending bands.Open the sheet
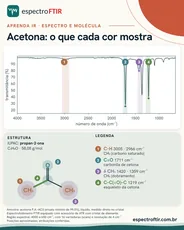 AcetoneKetone. The carbonyl and the C–C(=O)–C skeleton in the spectrum.Open the sheet
See all the sheets · Search by name, CAS or formula · the others open with your email, without using credits.
LEARN IR · YOUR LEARNING PATH
The report documents the analysis parameters, criteria used and data limitations.
Indicates compatible functional groups and compound classes. It does not identify substances or estimate probabilities.
Your files are used for the analysis. Use for service validation requires your optional consent.
Created by a professional trained in Pharmacy and Chemistry, specialized in Forensic Toxicology, drawing on experience with infrared spectroscopy in analytical and forensic chemistry.
AUDIENCE
From teaching to the lab, from forensics to industry.
UPLOAD HELP
Request context:
The category was selected from the notice; it does not confirm the cause of the problem. Your file and sample name are not attached to the request.
Your free preview
Review the spectrum and a sample of interpreted bands. You can also save this preview as a PDF.
 Download preview PDF
Short PDF with the plot and the same sample of bands shown on this page. Free, without using credits. The link expires with the preview.
This result comes from an image of the plot, and the reading is approximate: band positions carry an uncertainty of a few cm⁻¹, weak or close bands may not appear and the vertical axis is not read, so spectrum quality is not assessed. The result may differ from the one obtained with the data file of the same spectrum.
For the most faithful result, export the spectrum from the instrument software as CSV, DPT or JCAMP (or use the original file, such as .0 or .sp) and submit that file.
The magenta line is the curve that was read; it should overlap the curve in your plot. The blue numbers mark the points used to calibrate the X-axis and should match the numbers on your plot. The overlay shows the curve and the axis; whether the plot is transmittance or absorbance is confirmed in the “Spectral quantity” box just below, and the report depends on that choice.
The verification image could not be generated. For that reason the report cannot be released from this image: replace the image, use the image-to-CSV converter or submit the spectrum data file.
If the curve or the blue numbers do not match your plot, do not release the report: in the image-to-CSV converter, free, you enter the X-axis values and get the CSV ready to submit.
Up to three rows; this is a partial selection, not a ranking of scientific importance.
The full report includes the complete table, discussion by region, method, limitations and references.
View and export
The preview shows the full curve, watermarked and at reduced resolution, and a sample of the table. The free PDF contains the same sample. Reports using paid credits include the full table, discussion by region, PDF, editable Word and supplementary files. Eligible new accounts receive 1 welcome credit after confirming their email, to try a full PDF report. Previously granted balances are preserved.
What do you need before continuing? You can answer and keep using the site as usual.
No password: we send a six-digit code to your email.
Select an analysis to reopen the results. Files remain available until the date shown and are then automatically deleted.
REPORT EXAMPLES
Click the thumbnails to open examples. No credits are used.
Free previewFull watermarked curve and up to three band rows. One-page PDF, no signup required.View preview PDF Example using synthetic data.
Full reportFull band table, interpretation by region, method, limitations and references.View report PDF
Summary sheetPlain-language summary of the main analysis results.View summary-sheet card
Generating your own full report or summary sheet requires 1 credit per spectrum. Free credits provide PDF only; paid credits also include editable Word and supplementary files for the selected format.
Each spectrum uses 1 credit, with the report included. Credits do not expire while the service is available.

 Payment processed by
 . We do not receive or store your card details.
Sales are intended for individuals.
